
Everyday weather, done properly.
Sun, clouds, rain, snow and storms — town by town in Italy and across all of Europe, up to 4 days ahead. And on the same map: weather radar, pollen species by species, air quality and the state of the sea — with a multi-model reliability index. All free.
🌍 All of Europe, the best model for every country
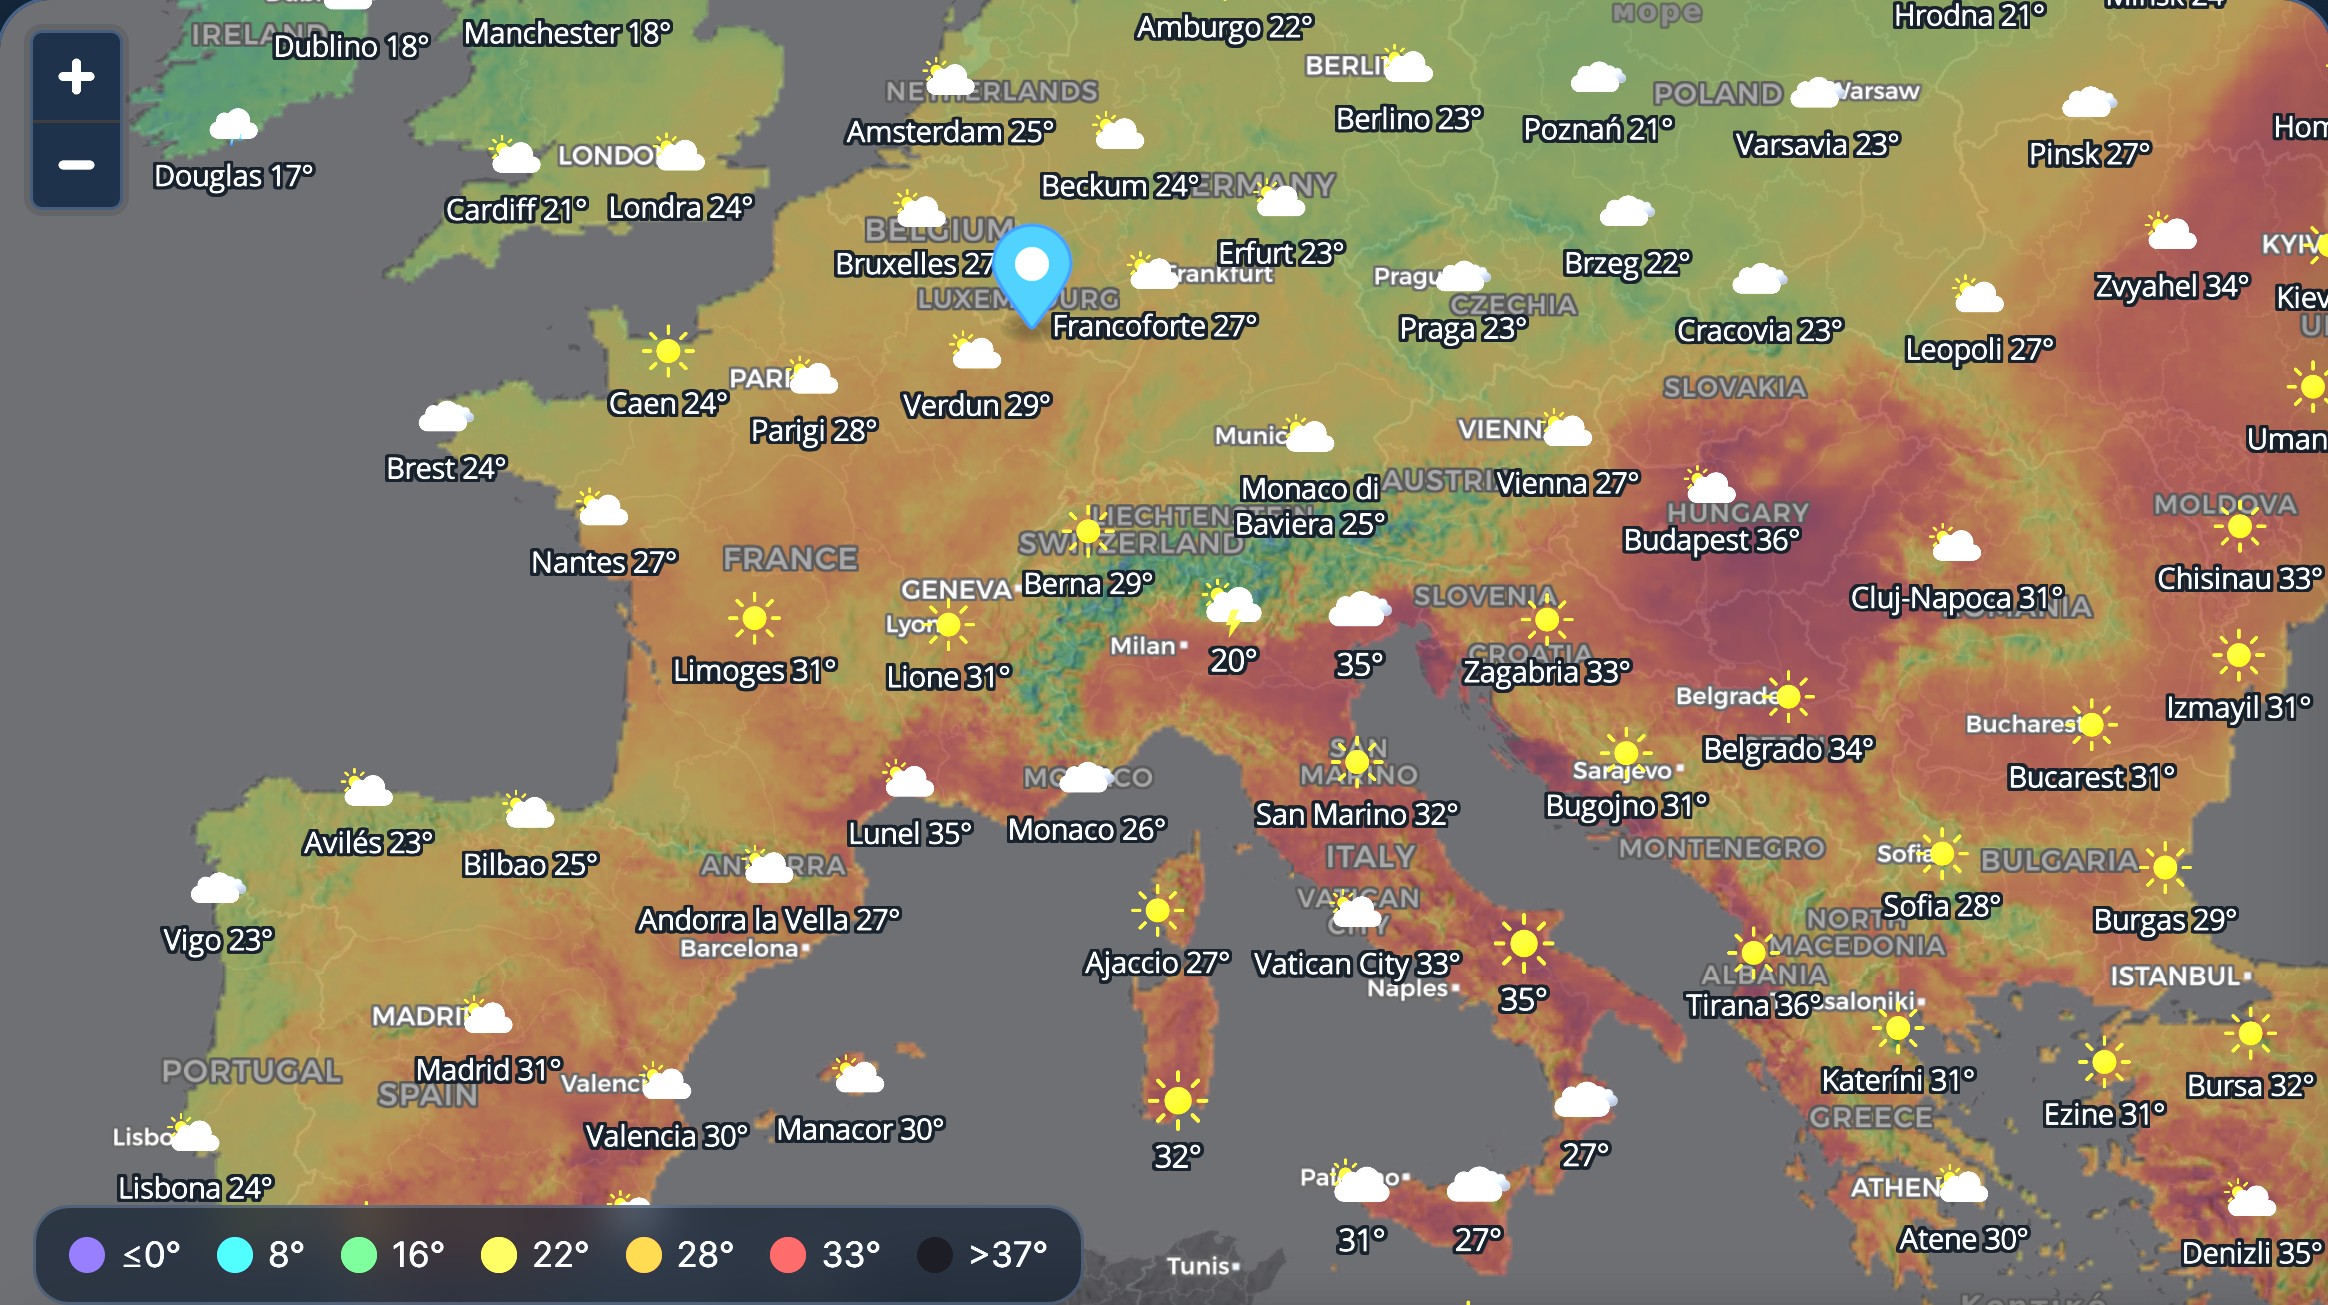
The map doesn't stop at the border: zoom out and you get the whole continent — from Lapland to Gibraltar, from Lisbon to Istanbul. And not by stretching one global model over Europe: ExtremeCast compares several sources and picks, for each area, the best high-resolution model available, merging everything into its own reading.
Local detail
Where a high-resolution national model exists, you get its detail — down to 1 km in the Alps and Scandinavia — instead of a continental average.
One reading
Several sources compared and merged by ExtremeCast into a single, consistent forecast: no gaps, no jumps at the borders.
Agreement shown
Every card carries a reliability index: how much the models agree here, right now.
Every place gets the best source available for it, and your card stays complete everywhere — up to 4 days ahead.
Rain probability and reliability — our own numbers
Two values in every location card come from our processing, not from a single model:
Rain probability
Built from several independent models and from the behaviour of the surrounding area — because a shower is a local affair: what the number really tells you is how likely rain is around you.
Reliability index
How much the models agree on your spot. High = solid forecast; low = the atmosphere is uncertain here, worth checking again later. We show uncertainty rather than hiding it.
The map layers: sky, temperature, rain
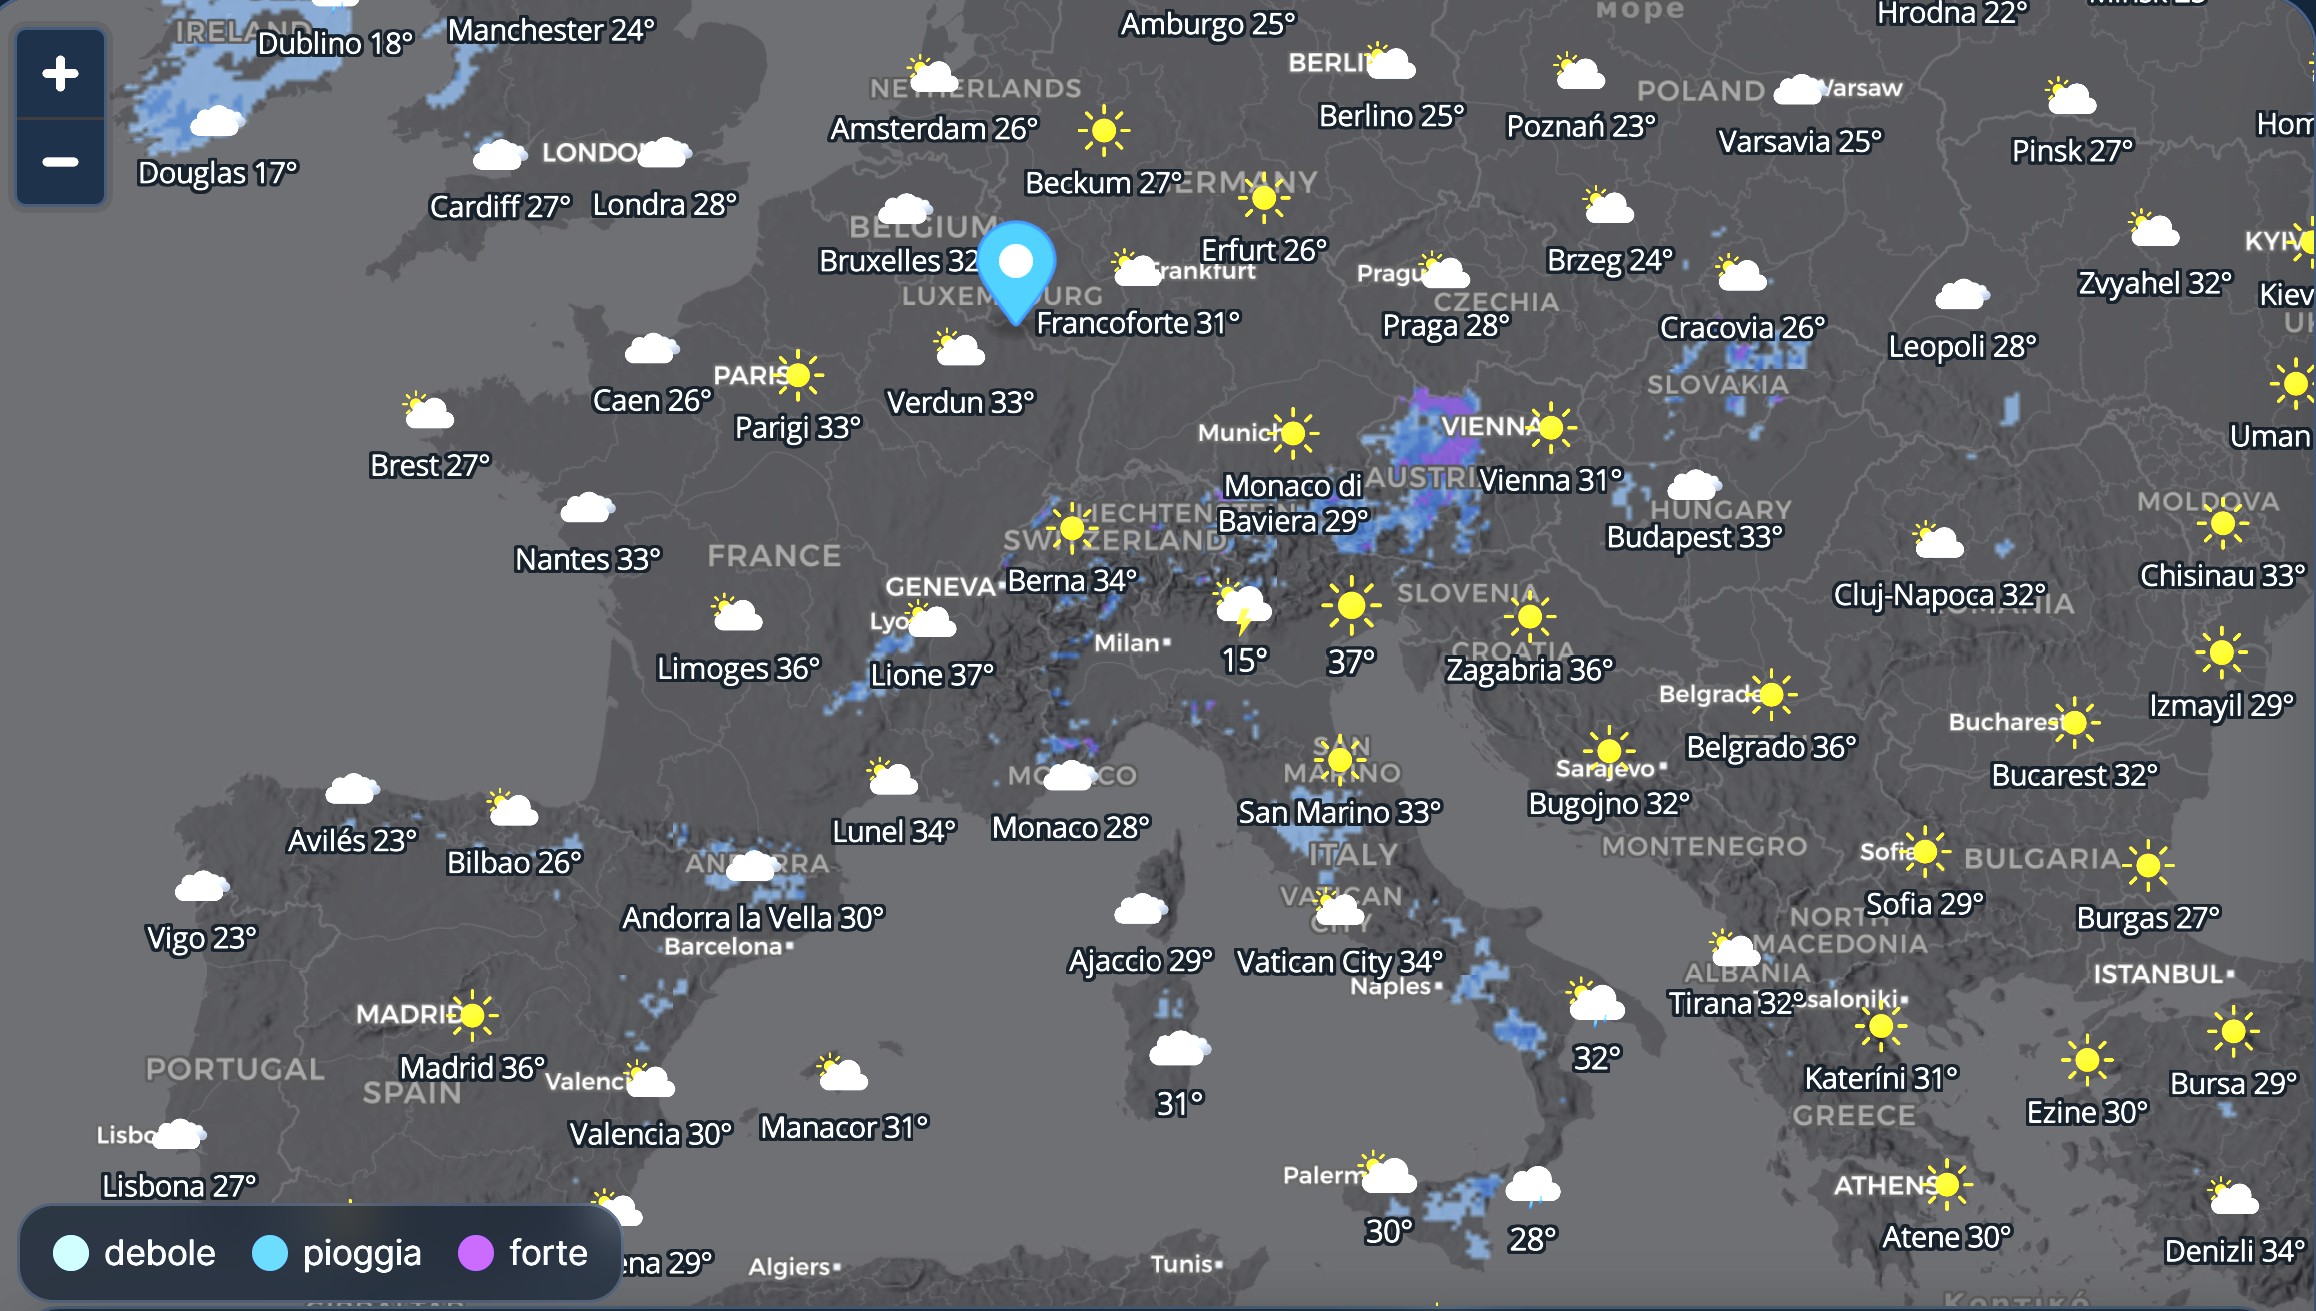
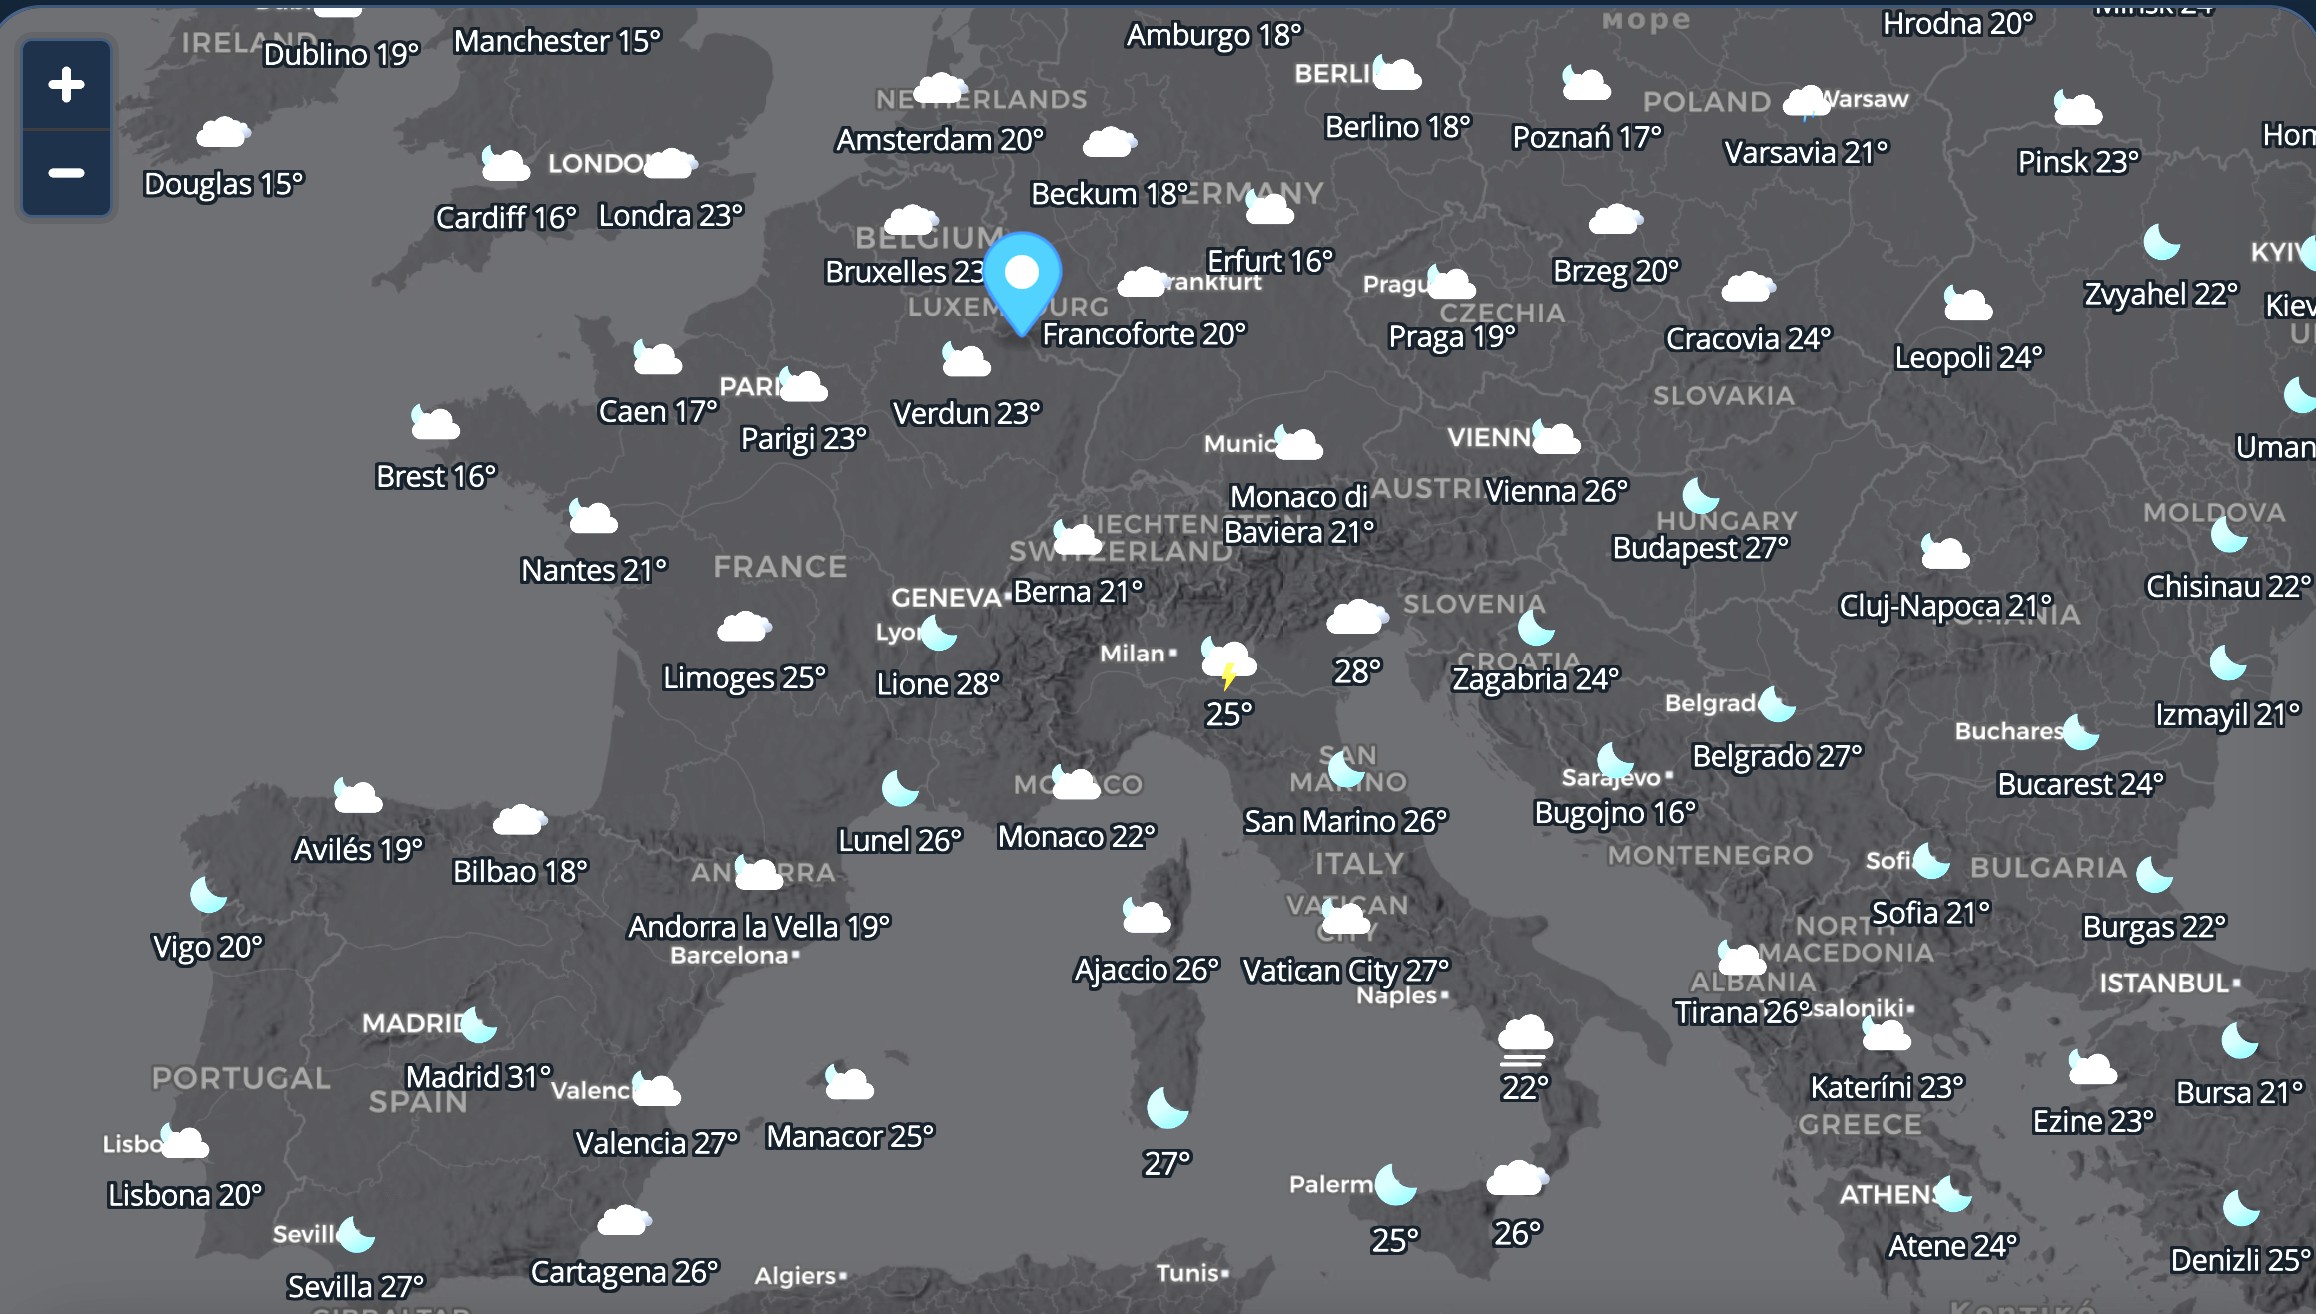
One tap changes how you read the map. Sky shows cloud cover and weather type; Temperature paints the continent in thermal bands; Rain highlights where and how much it will rain, staying transparent where it stays dry. The fourth layer is Radar, which shows what is happening rather than what is forecast — see below.
Weather radar, over Italy and Europe
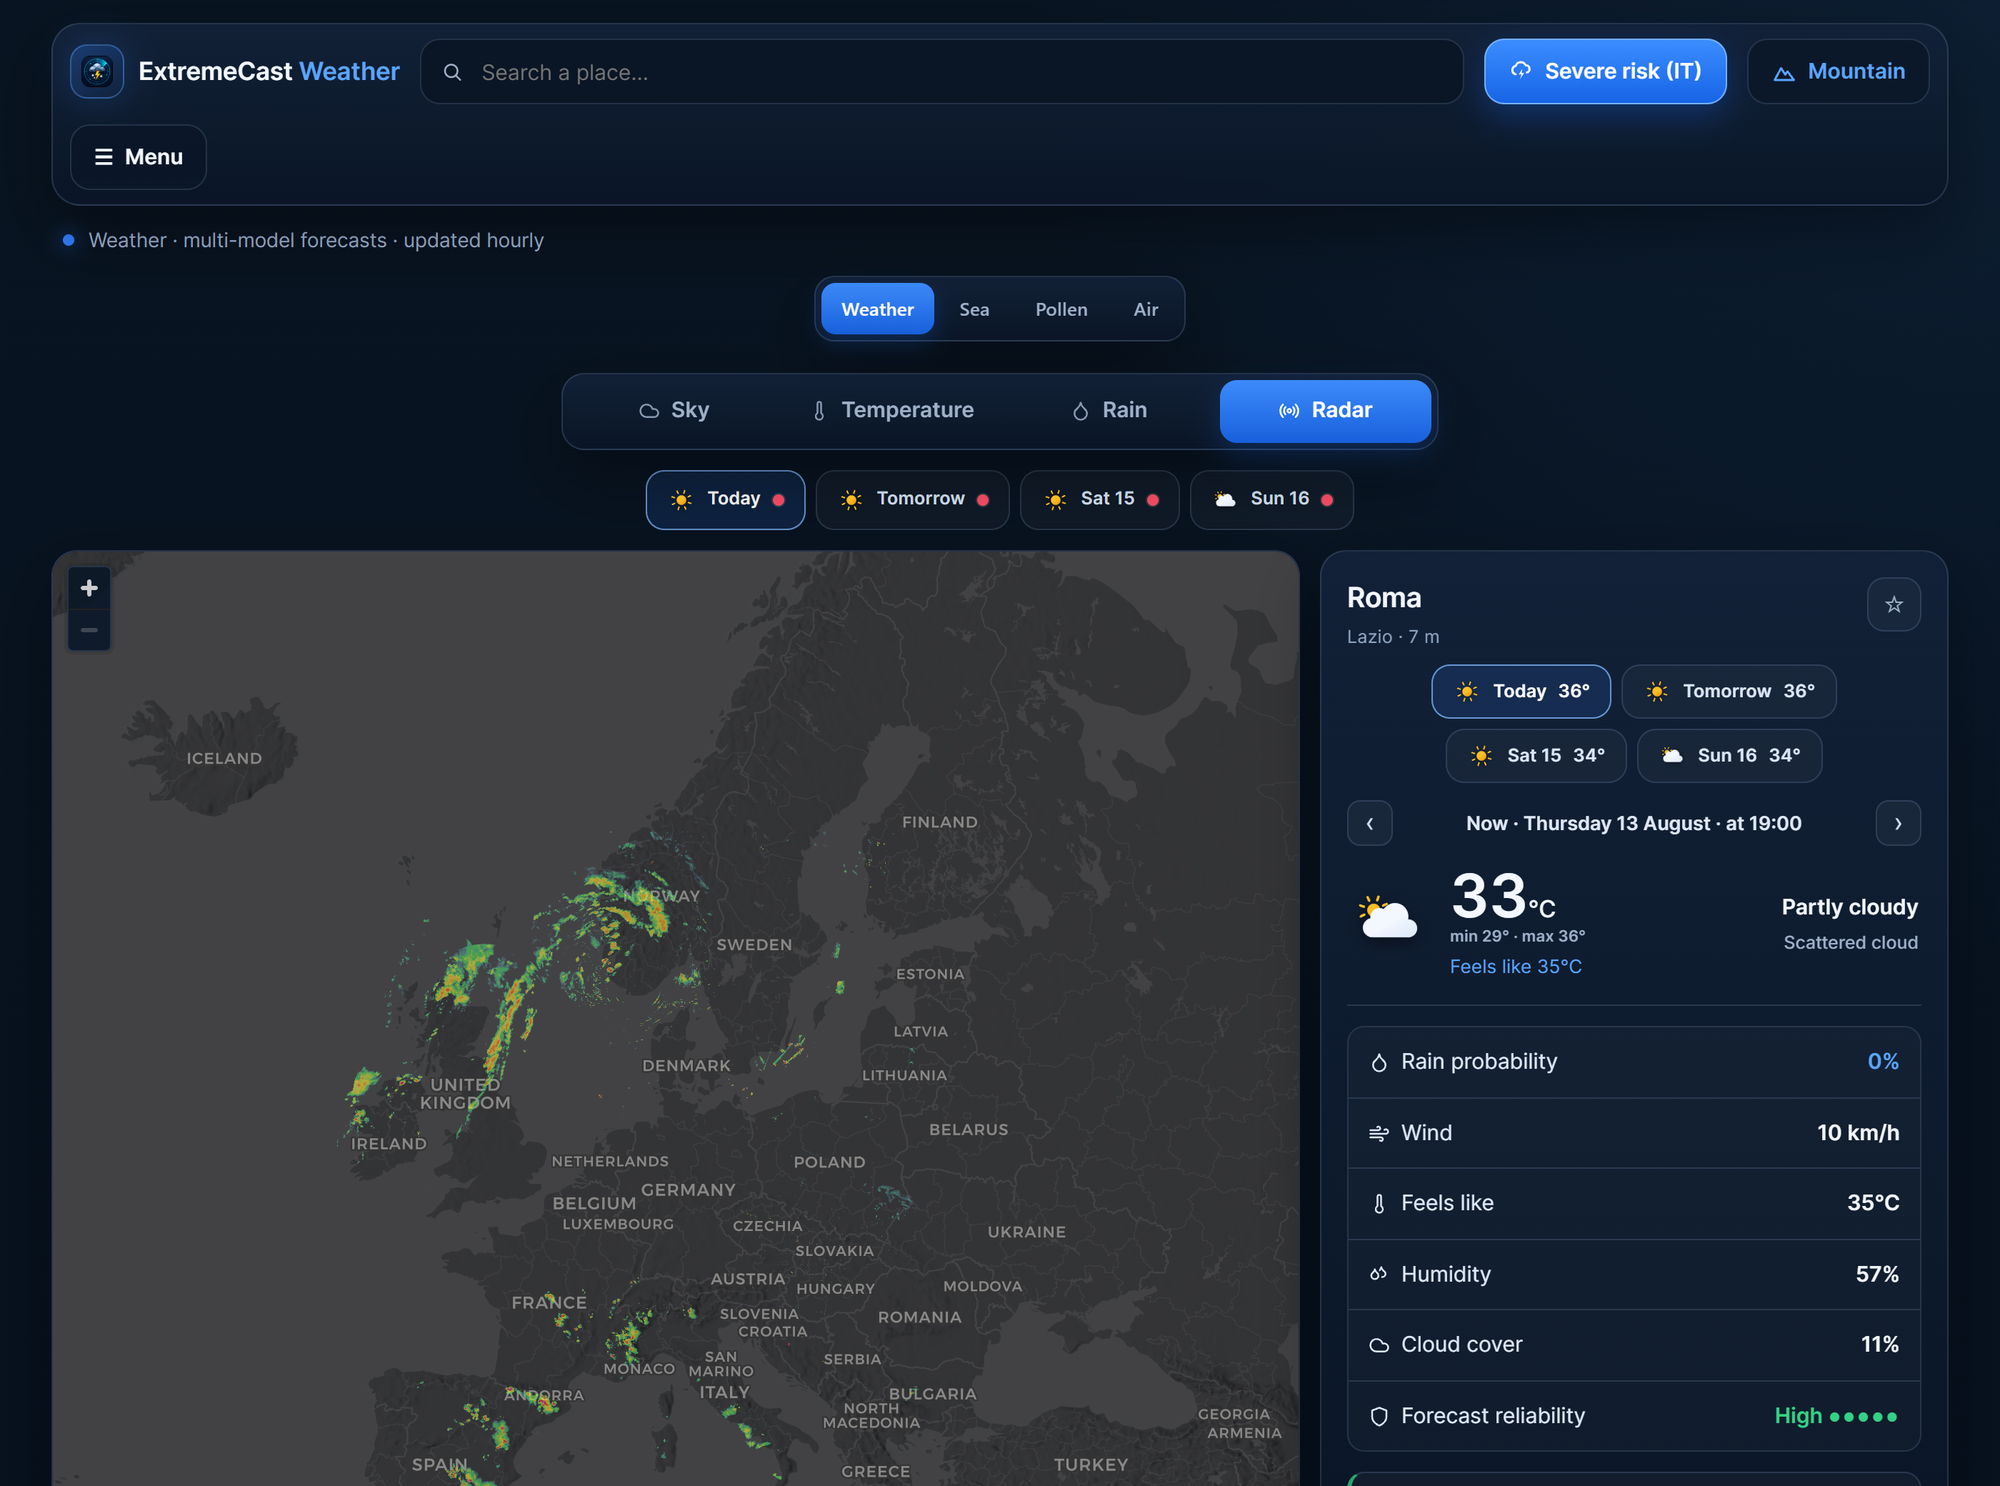
The Radar layer is the odd one out: it isn't a forecast at all. It shows observed precipitation — where it is raining right now — and it covers Italy and the rest of Europe. Zoom out and you can follow a front crossing France, showers over the British Isles and storms along the Alps in a single view.
Tap a point where there is an echo and you get its intensity in dBZ, with a plain-language reading next to it: below 20 dBZ a weak echo, 20–30 light precipitation, 30–38 moderate, 38–45 heavy, above 45 very heavy. Higher numbers mean a more intense echo — not a heavier forecast.
Pollen, species by species
The Pollen view doesn't stop at a single "pollen level". Tap a point and you get each available species on its own line, with its value in gr/m³ and its own rating — so if you only react to one of them, you don't have to guess from a combined index.
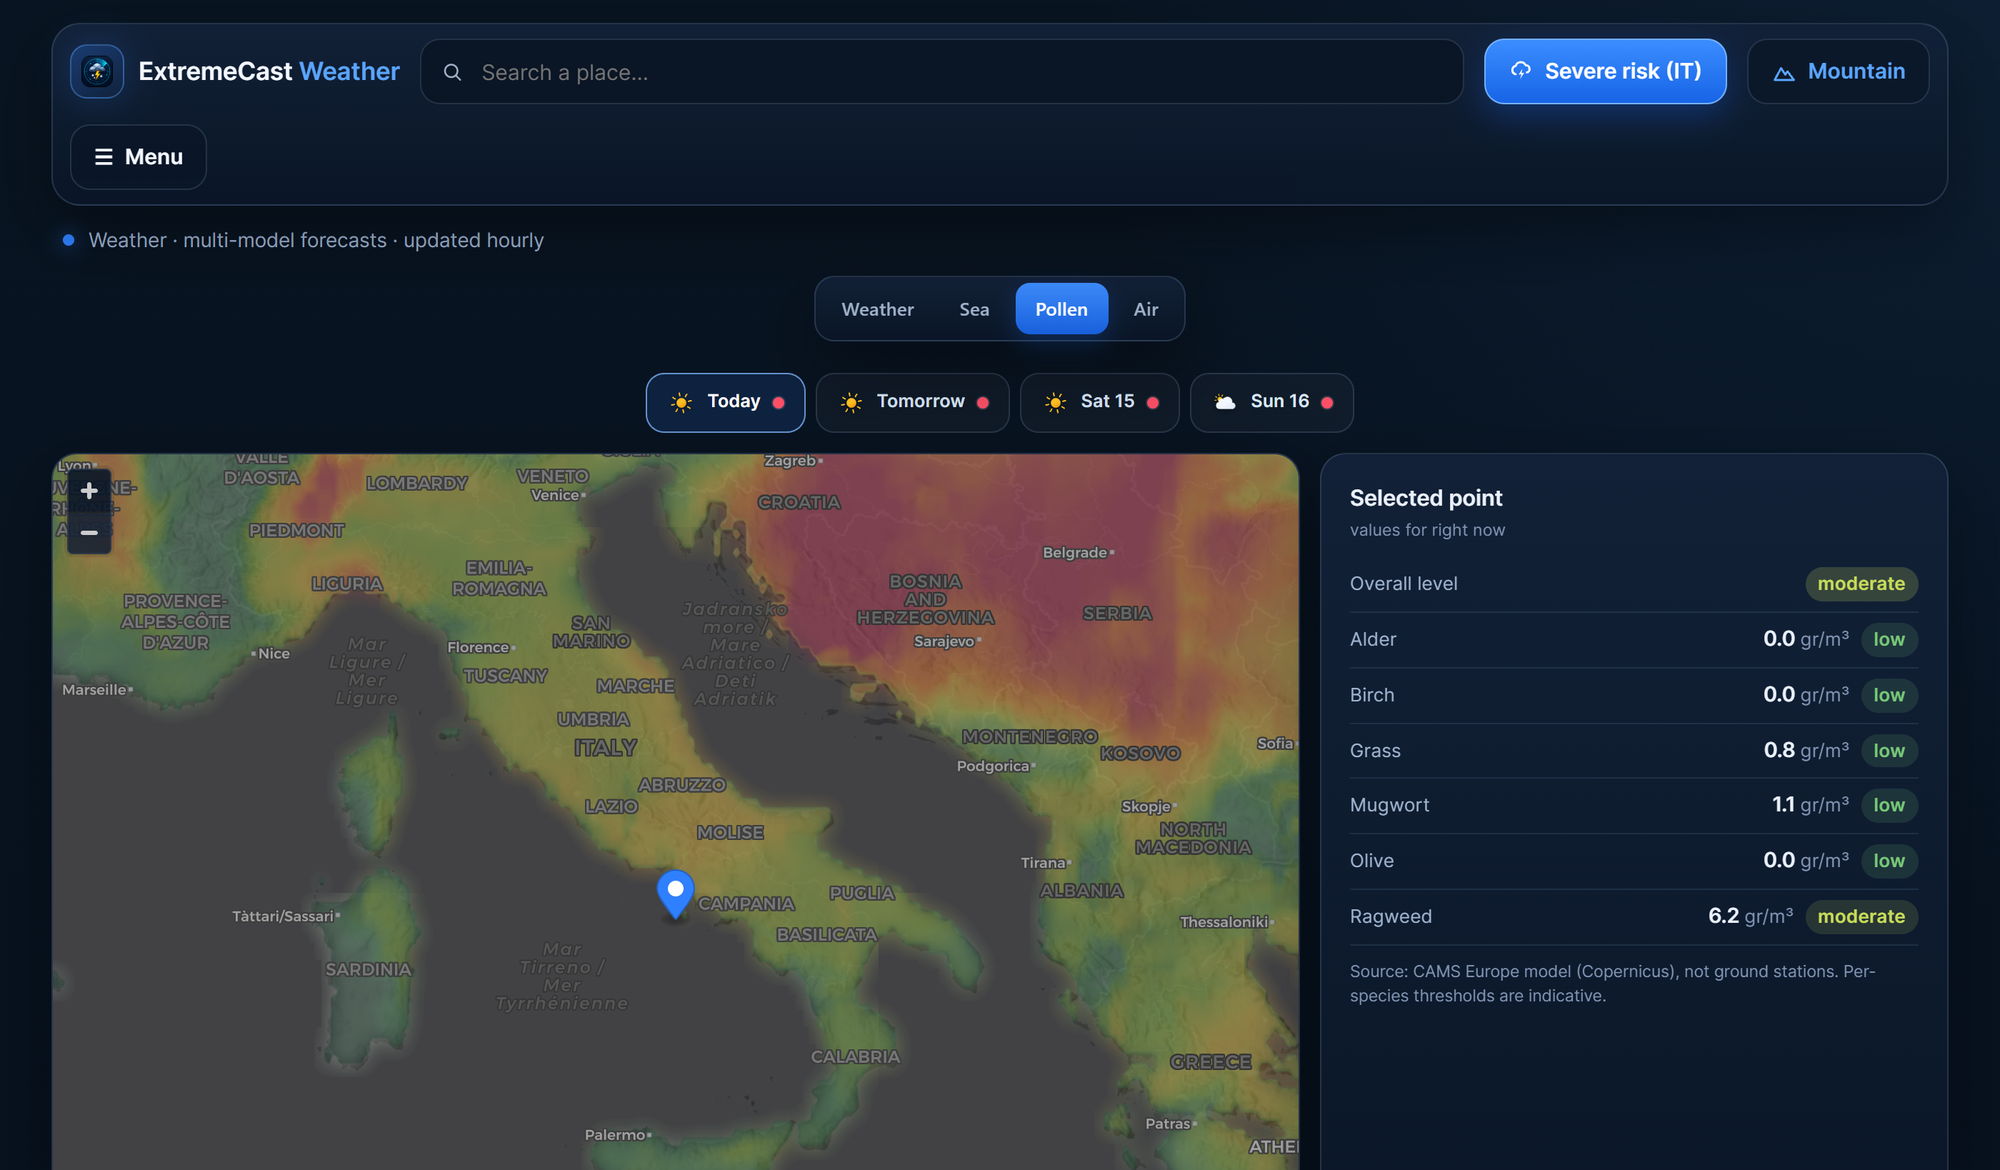
Source: the CAMS Europe model (Copernicus). These are modelled values, not readings from monitoring stations, and the per-species thresholds are indicative.
Air quality
The Air view colours the map by PM2.5 and, for the point you pick, gives you the main pollutants:
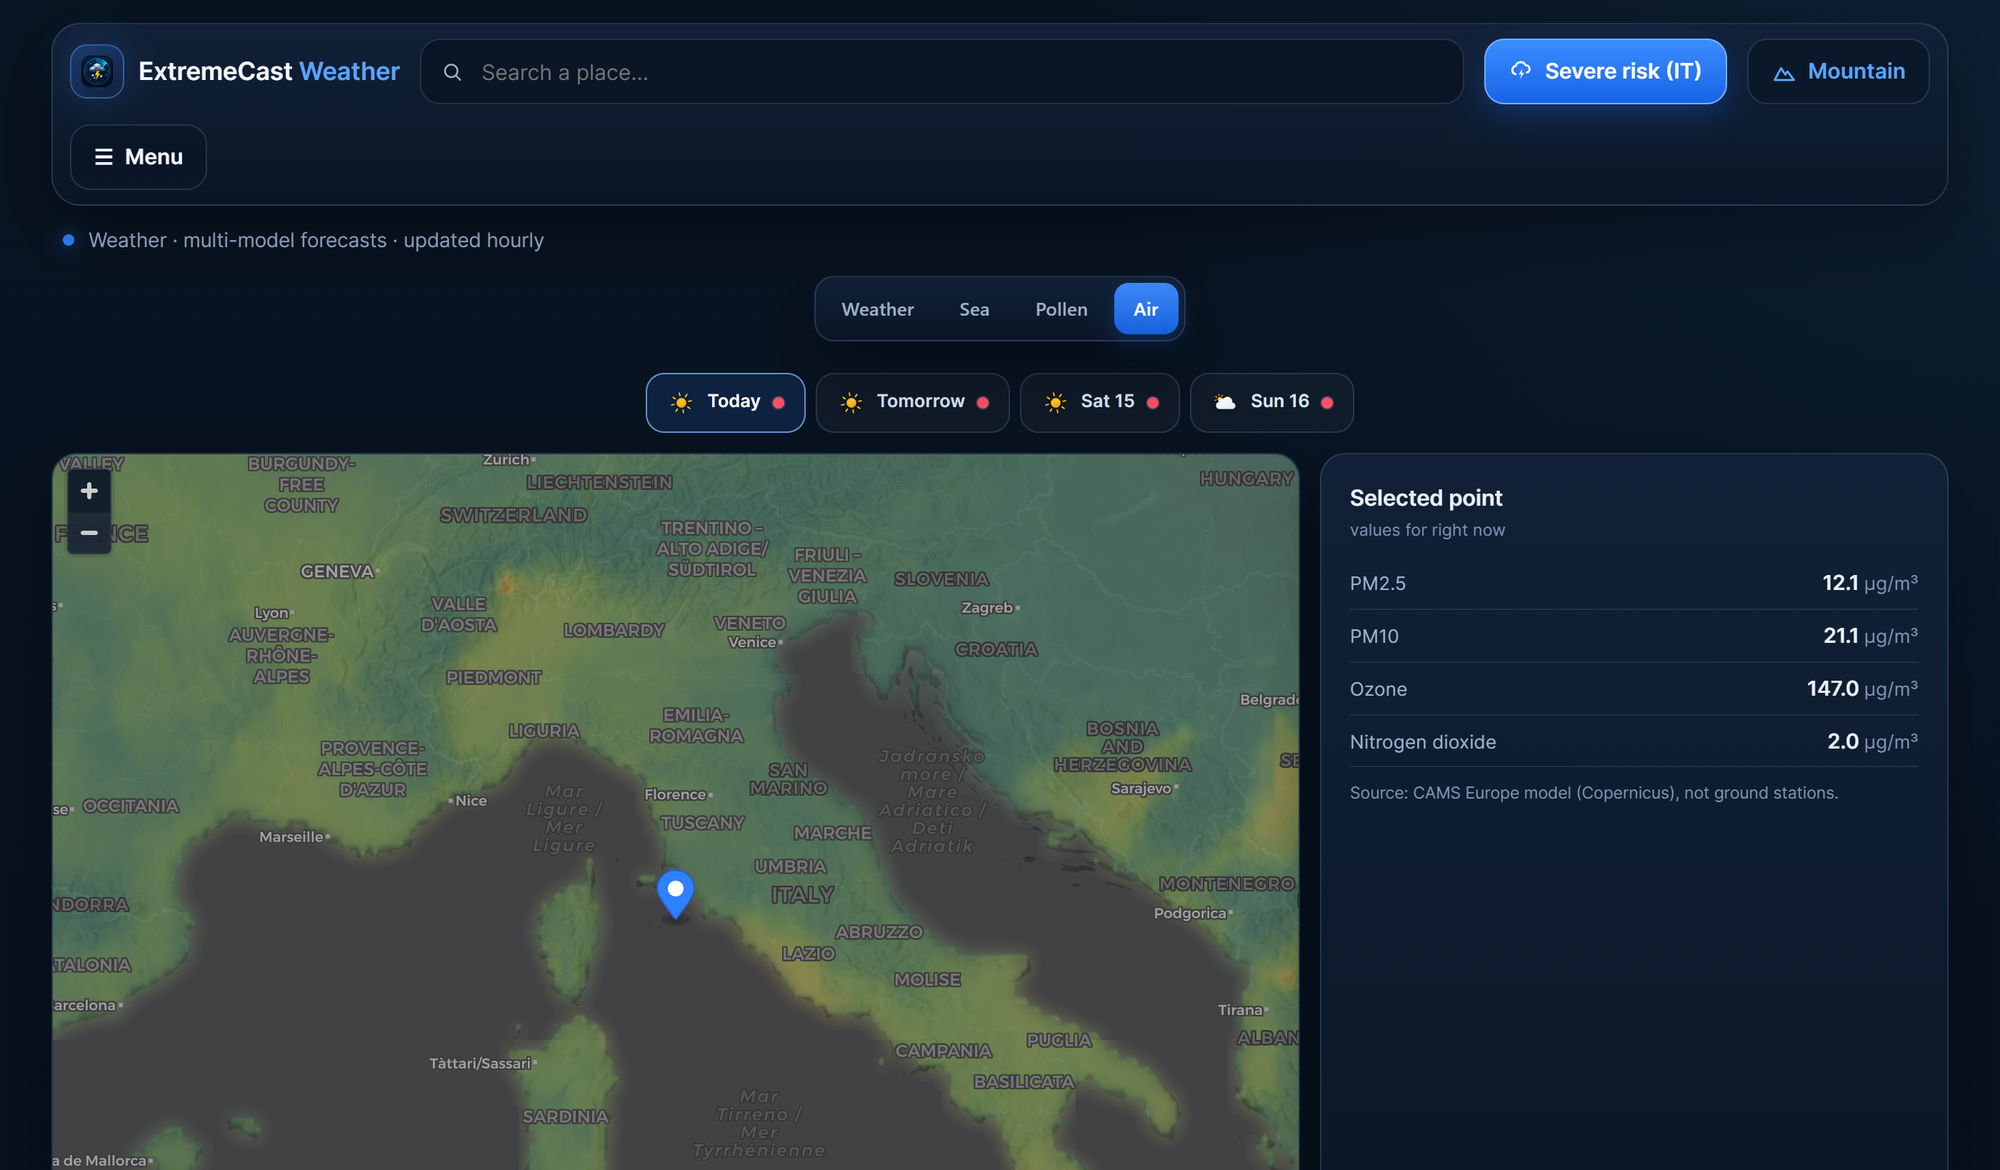
Source: the CAMS Europe model (Copernicus) — modelled values, not monitoring stations.
Sea and waves
The Sea view colours the water by wave height and, when you tap a point offshore, gives you the three numbers that actually decide a day on the water:
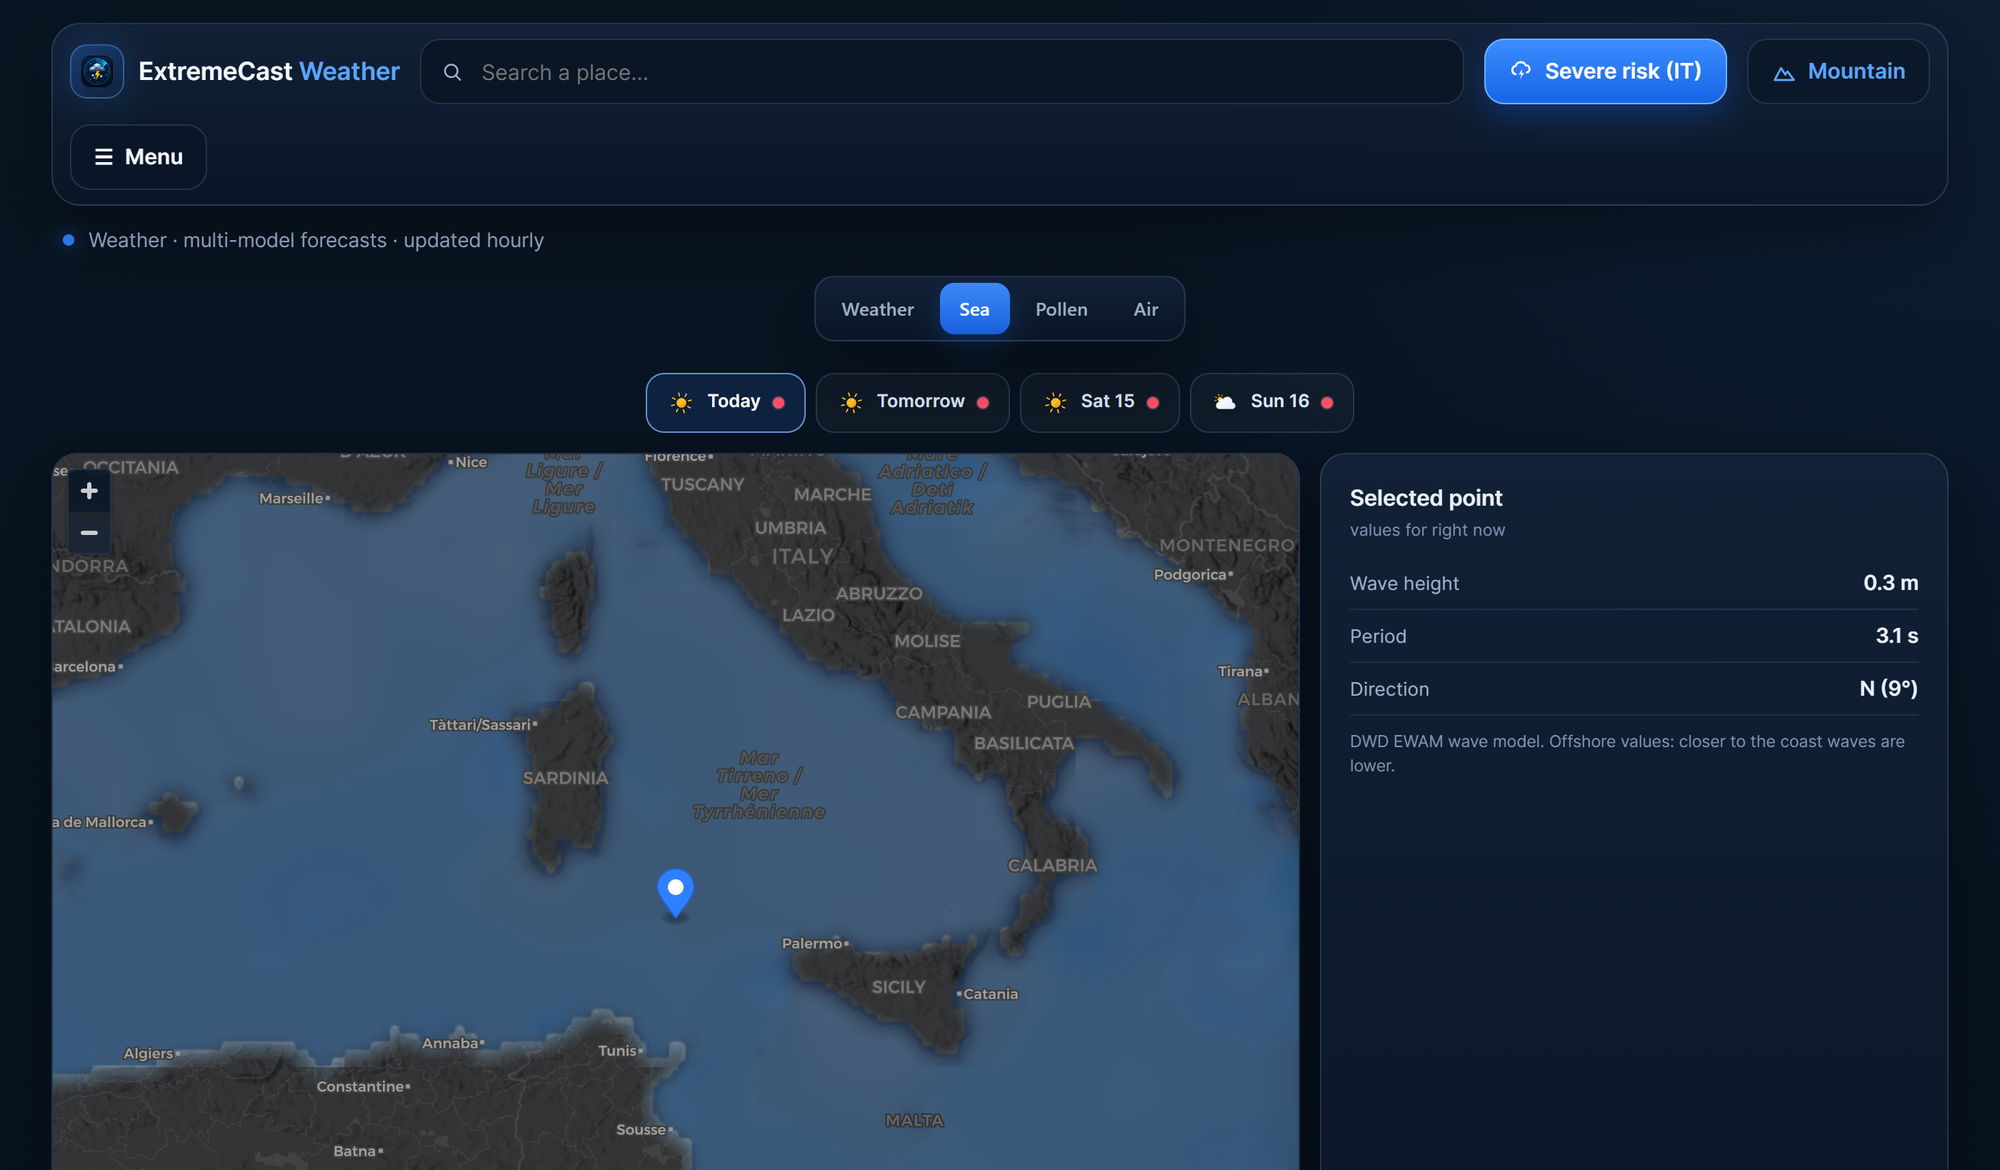
Wave model: DWD EWAM. Values are offshore — closer to the coast, waves are lower.
Search anywhere, then click
Type "Paris", "München", "Den Haag" or "L'Aia": the search knows 70,000+ European places, in local names and Italian exonyms alike. Or just click anywhere on the map — a Pyrenean village or a Norwegian fjord — and the full card opens: temperature and feels-like, rain probability, wind, humidity, cloud cover and reliability.
The interactive meteogram
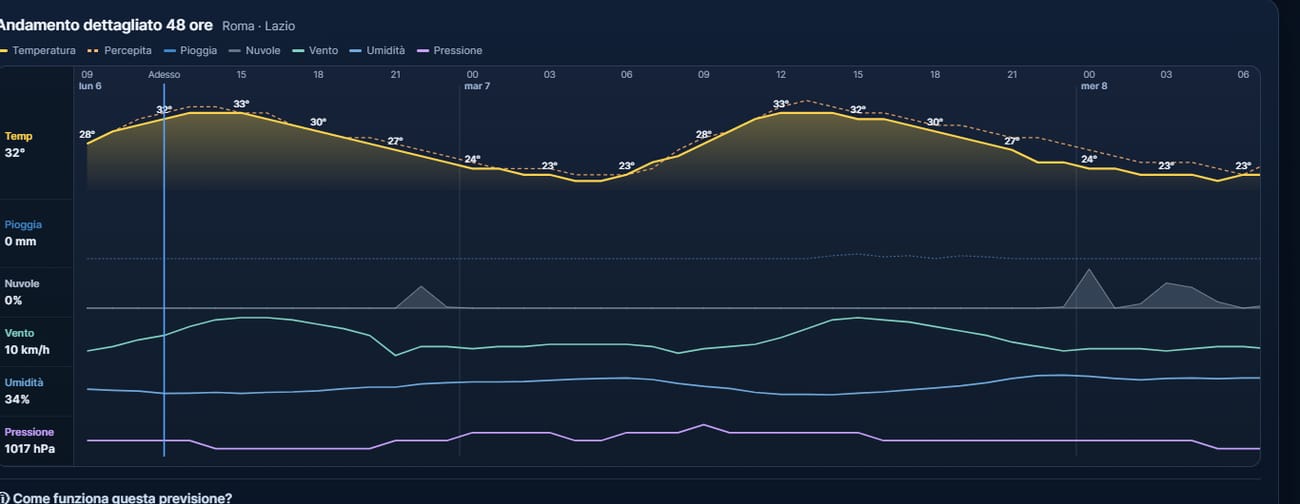
From the location card you can open the detailed trend: one chart with temperature, feels-like, rain, cloud cover, wind, humidity and pressure, hour by hour over the coming days. Hover it (or touch it) to read the exact values at any hour and see when the weather turns.
How often it updates
The map is rebuilt every 3 hours, and each source is refreshed as soon as a new run is published. The location card you open with a click is live: it is computed on the spot, so it always reflects the freshest data available.
Data: Open-Meteo and national weather services (DWD, Météo-France, MeteoSwiss, GeoSphere, KNMI, DMI, MET Norway, CHMI, UK Met Office, ARPAE) — CC-BY licence. Model selection, rain probability and reliability index: ExtremeCast processing. Radar: Italian Civil Protection Department (Italy) and the EUMETNET/OPERA network (rest of Europe). Pollen and air quality: CAMS Europe (Copernicus). Waves: DWD EWAM.
Also in ExtremeCast — Italy only
Two more products live inside ExtremeCast and are, today, available for Italy only: the severe-storm risk map (hail, damaging gusts, torrential rain, storm cells, e-mail alerts) and Mountain (weather at the real altitude of 46,000 peaks, huts, passes and trails, with a winter ski mode). Both are built on ground truth we can verify — Italian radar, 3,750+ ground stations and human storm reports — which is exactly why we don't pretend they work elsewhere yet. Their pages are in Italian: severe risk · mountain.